Blog
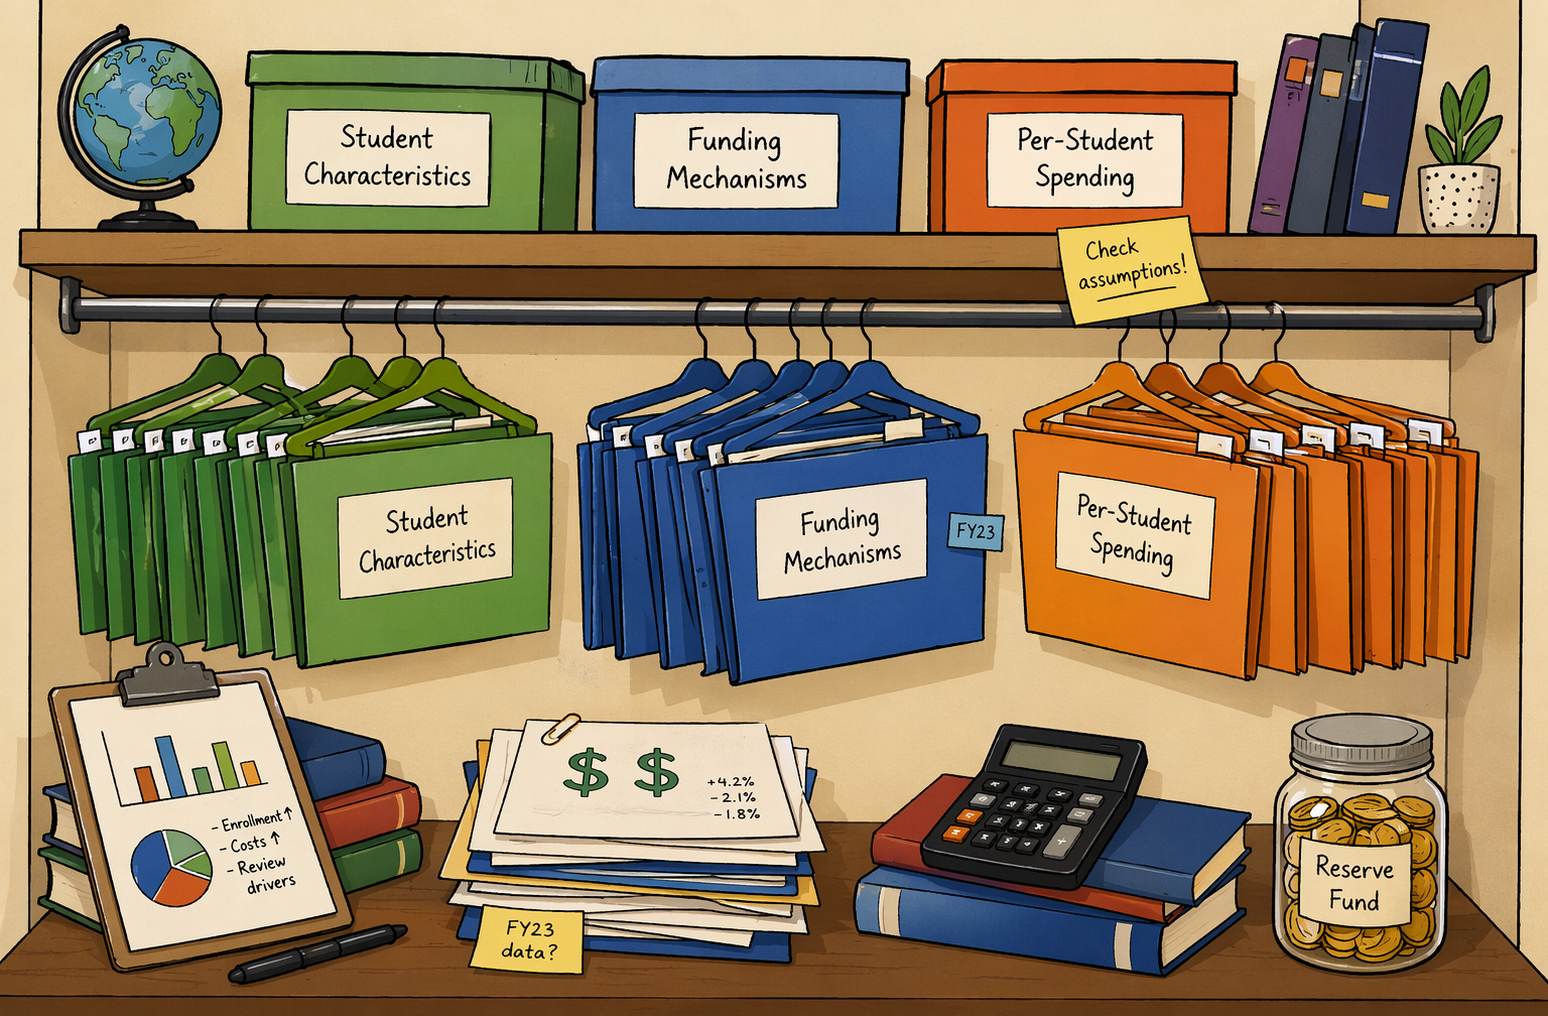
Education funding data lives in many different places—federal databases, state systems, and school district records. Because this information isn’t housed in one place or organized in the same format, it can be hard to understand how education funding works overall—or what it means for policy and funding decisions in a specific state. It’s like an overstuffed closet: everything you need is there but finding the right items and seeing how they fit together takes work.
So, we did some organizing. We created new tools and resources to help you find education funding data, sort through it, and make sense of what is happening in your state and states across the country.
Essentially, we went into the “data closet,” put things on hangers, and organized everything by function. Instead of using clothing categories like “formal” or “leisure,” we use information categories such as “student characteristics”, “funding mechanisms”, and “per-student spending.”
In this blog post, you’ll learn about new SFF resources:
- SFF's State Funding and Finance Data Map
- The Education Finance 101 Blog Series
- Expert Conversations and State Perspectives Podcasts (coming soon)
Each resource is organized by six key categories:
- Student characteristics
- School, programs, and workforce
- Community characteristics
- Finance and funding
- Revenue used for education
- Strategic funding and flexibility
To build these resources, we analyzed each data source, and each data element within it, then organized the information into six categories. We then looked across all the categories to identify gaps where additional data was needed to complete the picture. Essentially, we opened up every box in the data closet, grouped items by what they tell us, and made a plan to fill in what was missing.
The SFF Interactive Funding and Finance Data Map
We are excited to announce the release of the interactive SFF Funding and Finance Data Map. The map brings together publicly available data from federal, state, and district sources into a single, integrated dataset and presents it in a state-by-state view. Users can explore a wide range of indicators related to student characteristics, school and workforce conditions, funding structures, revenue sources, and per-student spending—making it easier to see how education funding systems vary across states and how different pieces fit together.
We are constantly growing the map and updating it when new data or map tools become available.
Data Sources Used to Develop the Map
We drew on the following data sources to build the map:
- American Community Survey (ACS)- The ACS is a dataset for social, economic, housing, and occupational data that is compiled by the U.S Census Bureau annually.
- Bureau of Labor Statistics- The BLS is a dataset on employment, jobs, and earnings across the country. Every year, the BLS conducts large-scale surveys of households and businesses and compiles a universe of data on employment across the country.
- Center for the Study of Child Care Employment (CSCCE): Compensation Tracker- The CSCCE compiles an early childhood education compensation policy database, which tracks policy changes in early childhood education compensation across the country. They also compare wage data across states, utilizing data from the ACS.
- Common Core of Data (CCD)- CCD is a universe dataset for PK-12 public education information compiled by the National Center of Education Statistics (NCES), part of the Institute of Education Sciences (IES) within the U.S. Department of Education.
- Education Commission of the States (ECS) 50-State Comparison Series - ECS compiles data across a variety of topics, including K-12 Funding methods, to allow for comparisons across all states. ECS collects the information for their comparison series from state statute, policy regulations, enacted state budgets and state education agency documents.
- EdChoice Report: How States Protect Funding for K-12 Public Schools: A Summary of State Policies- This report summarizes publicly available information for each of the 50 states about how enrollment informs their state funding formulas. Data was collected and analyzed for this policy scan by Hanover Research.
- 2024 National Institute for Early Education Research (NIEER) State of Preschool Report- The 2024 NIEER State of Preschool Yearbook is published by the National Institute for Early Education Research (NIEER) at Rutgers University. It provides an annual overview of pre-K across the nation, drawing on annual state of preschool survey data collected across states.
- National Education Association (NEA) Rankings of the States and Estimates of School Statistics Report- The NEA Rankings and Estimates Report is compiled annually based on data collected from state departments of education and survey responses from state education agencies.
- Office of Career, Technical, and Adult Education: Perkins V Enrollment Data Explorer- The Office of Career, Technical, and Adult Education, through the Perkins Collaborative Resource Network, conducts data on enrollment in Career and Technical Education courses in secondary grade levels.
- Private School Survey (PSS)- The PSS is a universe dataset for PK-12 private education information compiled by the National Center of Education Statistics (NCES), part of the Institute of Education Sciences (IES) within the U.S. Department of Education.
- School Finance Indicators Database (SFID) - SFID is a collection of data and resources on K-12 school funding in the United States. It is published by researchers from the Albert Shanker Institute, University of Miami, and Rutgers University and utilizes data from the CCD, PSS, and ACS to compare states across indicators.
The Education Finance 101 Blog Series
We’re also writing a series of blogs to demystify the ins and outs of education financing. The series will include both basic information and closer looks at topics such as:
- How states fund education
- How funding formulas work
- What services different sources of revenue pay for
- How spending patterns vary across states
These posts will help readers better understand the building blocks of education finance and the policy choices that shape funding decisions.
Expert Conversations and State Perspectives
And finally, we’re getting ready to launch expert conversations and state perspectives—podcasts where we discuss how education funding works in real life with education finance experts and state administrators. These conversations explore topics such as:
- Funding formulas
- State policy choices
- Implementation challenges
- The tradeoffs that shape how dollars are distributed
The podcasts will explain the technical side of education funding and share real-world perspectives that the data alone can’t show.
Take a Look!
Getting our data out of boxes and organizing it by function helps us create a clearer picture of how this information informs education funding and policy decisions. Whether you’re a parent, taxpayer, educator, advocate, or policymaker, our map, blog series, and expert conversations offer accessible tools that will help you understand how education funding works in your state and across the country.
We’ll continue “shopping” for new data to make sure you have the right information for every occasion. Take a look at the tools and resources—and email us at sffcenter@air.org to let us know what else would be helpful.